
For municipalities, businesses and housing associations
Solar screenings
SolarSim makes it easy to screen the solar potential across an entire building portfolio. We screen for municipalities, businesses, housing associations, property companies and anyone else who owns several buildings.
You get an independent, precise overview of which buildings are the best cases to pursue. The reports are also frequently used directly as a decision basis in management, on the board or in a political committee.
The screening builds on electricity consumption imported from Eloverblik and our SolarSim tool. You receive an individual report for each address and a combined overview that makes it easy to compare potential and economics across the buildings.
How it works
You grant access to the consumption data
The screening builds on the buildings’ actual hourly consumption, imported from Eloverblik.
We tailor the screening to each building
At an initial meeting we set the framework for the screening. All relevant parameters can be adjusted individually, so the calculations match each building. This could be future electricity consumption, prices, specific panels, batteries and other relevant assumptions.
We screen every building
SolarSim simulates all realistic system configurations and optimises system, battery and economics for each address.
You receive reports and an overview
An individual report per address plus a combined overview that makes it easy to compare the buildings, and is often used directly as a decision basis.
Handover meeting
We go through the reports together, and you have the opportunity to ask questions about the results.
What the screening is built on
The screening is built on hourly data for the individual building. The algorithm simulates every realistic system size and lands on the one that fits the consumption best.
Consumption and metering points from Eloverblik
| MålepunktsID | Netselskab | Effekt_kW | Effekt_A | Vejnavn | Nr | Postnr | By | Forbrug_2025_kWh | |
|---|---|---|---|---|---|---|---|---|---|
| 1 | 571313100000010947 | Elnet Vest A/S | 110 | 160 | Skolevej | 12 | 9999 | Eksempelby | 630.624,21 |
| 2 | 571313100000023155 | Elnet Vest A/S | 69 | 100 | Idrætsvej | 3 | 9999 | Eksempelby | 248.982,88 |
| 3 | 571313100000031482 | Elnet Vest A/S | 43 | 63 | Rådhusgade | 1 | 9999 | Eksempelby | 187.794,66 |
| 4 | 571313100000047319 | Elnet Øst A/S | 43 | 63 | Bibliotekstorvet | 5 | 9998 | Prøvestrup | 152.663,82 |
| 5 | 571313100000052806 | Elnet Øst A/S | 22 | 32 | Værkstedsvej | 7 | 9998 | Prøvestrup | 96.310,55 |
| 6 | 571313100000068441 | Elnet Vest A/S | 17 | 25 | Plejevej | 22 | 9999 | Eksempelby | 74.109,03 |
| … and the rest of the metering points | |||||||||
The system sized to the consumption
What the algorithm computes on
- Hourly electricity consumption imported from Eloverblik
- Hourly electricity prices
- Hourly shading profiles per roof surface
- Hourly production values
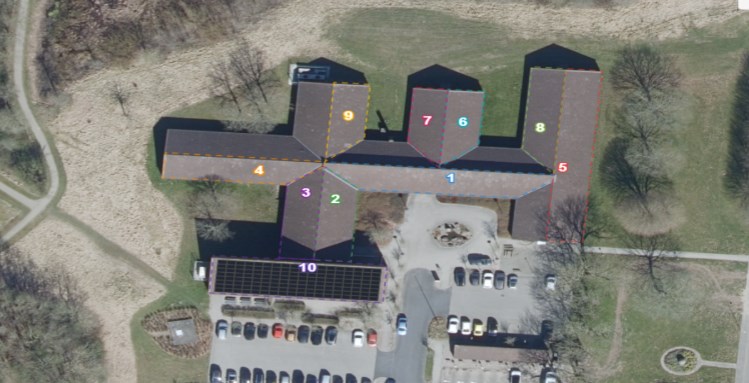
Every roof surface computed
| Surface | Roof area | Max | Panels | Pitch | Orientation | Shading | kWh/kWp |
|---|---|---|---|---|---|---|---|
| 10 Surface 10 Selected | 391 m² | 144 | 144 | 27° | 184° S | 7.2% | 1,091 |
| Surfaces not selected | |||||||
| 1 Surface 1 | 303 m² | 123 | – | 30° | 184° S | 9.3% | 1,068 |
| 4 Surface 4 | 201 m² | 74 | – | 25° | 185° S | 7.7% | 1,080 |
| 5 Surface 5 | 352 m² | 156 | – | 26° | 94° E | 19.6% | 833 |
| 8 Surface 8 | 179 m² | 68 | – | 24° | 275° W | 2.6% | 954 |
| … and the remaining five surfaces | |||||||
What you get
Combined overview across the buildings
Overview of the solar screenings
Your building portfolio
Total capacity
480 kWp
Annual savings
DKK 412,000
CO₂ savings/yr
36.4 t
| Address | System (kWp) | Payback (yrs) | Annual savings (DKK) | CO₂ (kg/yr) |
|---|---|---|---|---|
| Skolevej 12 | 98.4 | 6.4 | 89,500 | 8,600 |
| Idrætsvej 3 | 52.0 | 6.9 | 48,200 | 4,400 |
| Rådhusgade 1 | 30.8 | 6.1 | 33,900 | 2,700 |
| … and the rest of the portfolio | ||||
Individual report for every address
Solar potential screening
- Recommended solution: system size, panels per roof surface and battery
- Electricity consumption: actual hourly data from Eloverblik
- Roof analysis with selected roof surfaces
- Energy analysis: production, self-consumption and self-sufficiency
- Investment and operating costs
- Financial overview: annual savings and 25-year savings
- Battery assessment: every battery size simulated
- Sensitivity analysis on system size
- CO₂ savings calculated with hour-by-hour CO₂ intensity
- Calculation parameters and detailed financial appendix, plus CSV/Excel data on request
SolarSim does not sell solar panels and has no financial interest in whether you invest. The report is an independent decision basis.
Should we screen your building portfolio?
We work with
SolarSim delivers solar screenings and municipal licences to municipalities across Denmark.